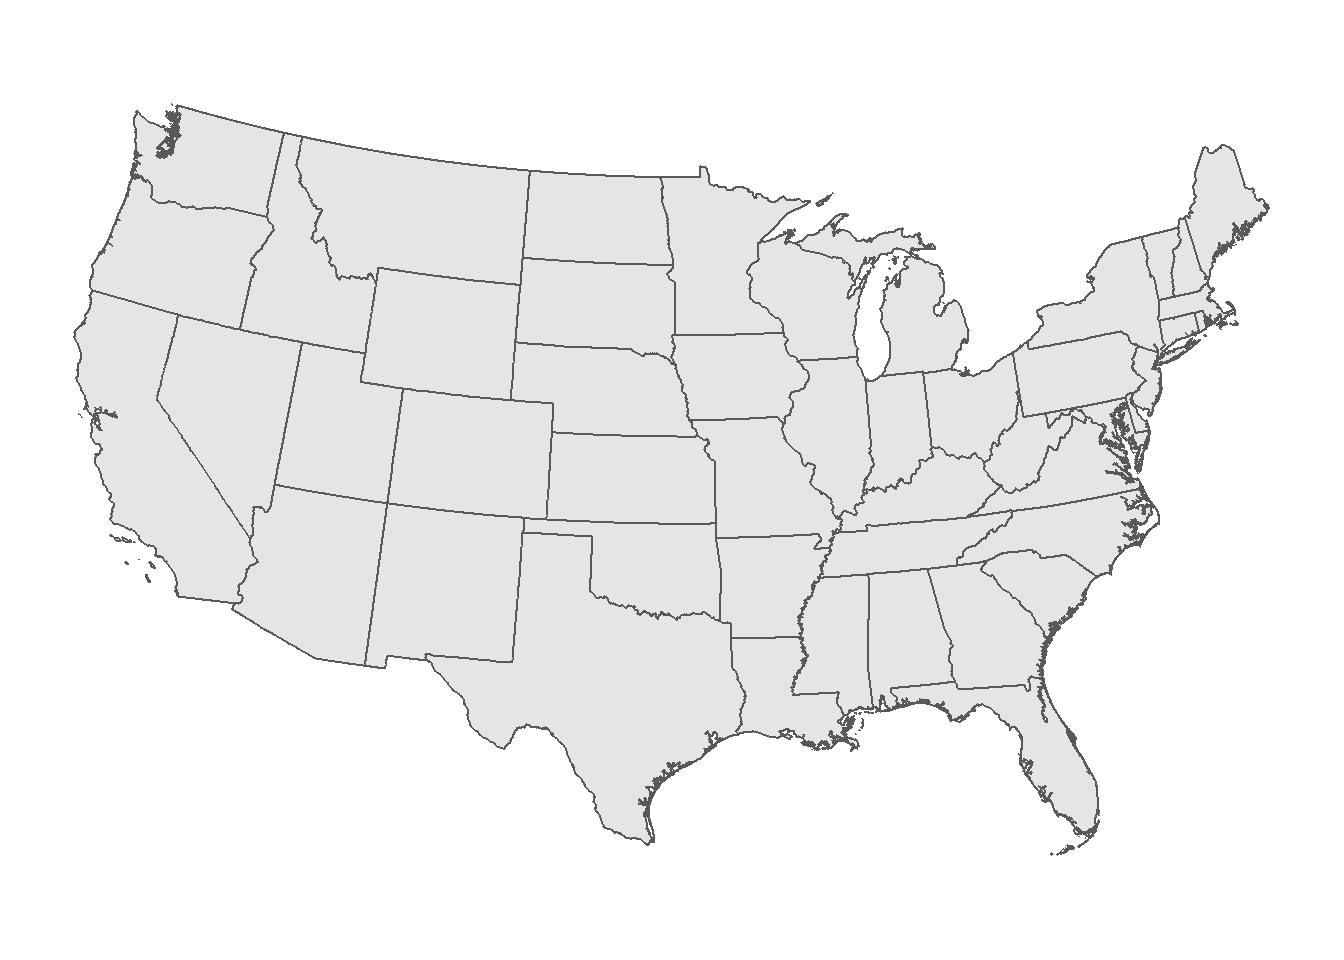
I have a map of the lower-48 United States - a very detailed map - that I use for choropleths.
Its detail means a lengthy print time, and many of the complex geometries within the map are not needed to distinguish individual states.
Recently I switched to a simplified map by way of the rmapshaper package.
Simplifying the map
Since rmapshaper has sf support, I can load and pass my sf class map directly to ms_simplify().
library(rmapshaper)
library(ggplot2)  # devtools::install_github("tidyverse/ggplot2")
load("states_map.RData")

# keep      = proportion of points to retain (0-1; default 0.05)
# weighting = Coefficient for weighting Visvalingam simplification (default is
#   0.7). Higher values produce smoother output. weighting=0 is equivalent to
#   unweighted Visvalingam simplification.

states_map_simp <- ms_simplify(states_map, keep = 0.0025, weighting = 0.9)

# Print
ggplot(states_map_simp) +
  geom_sf()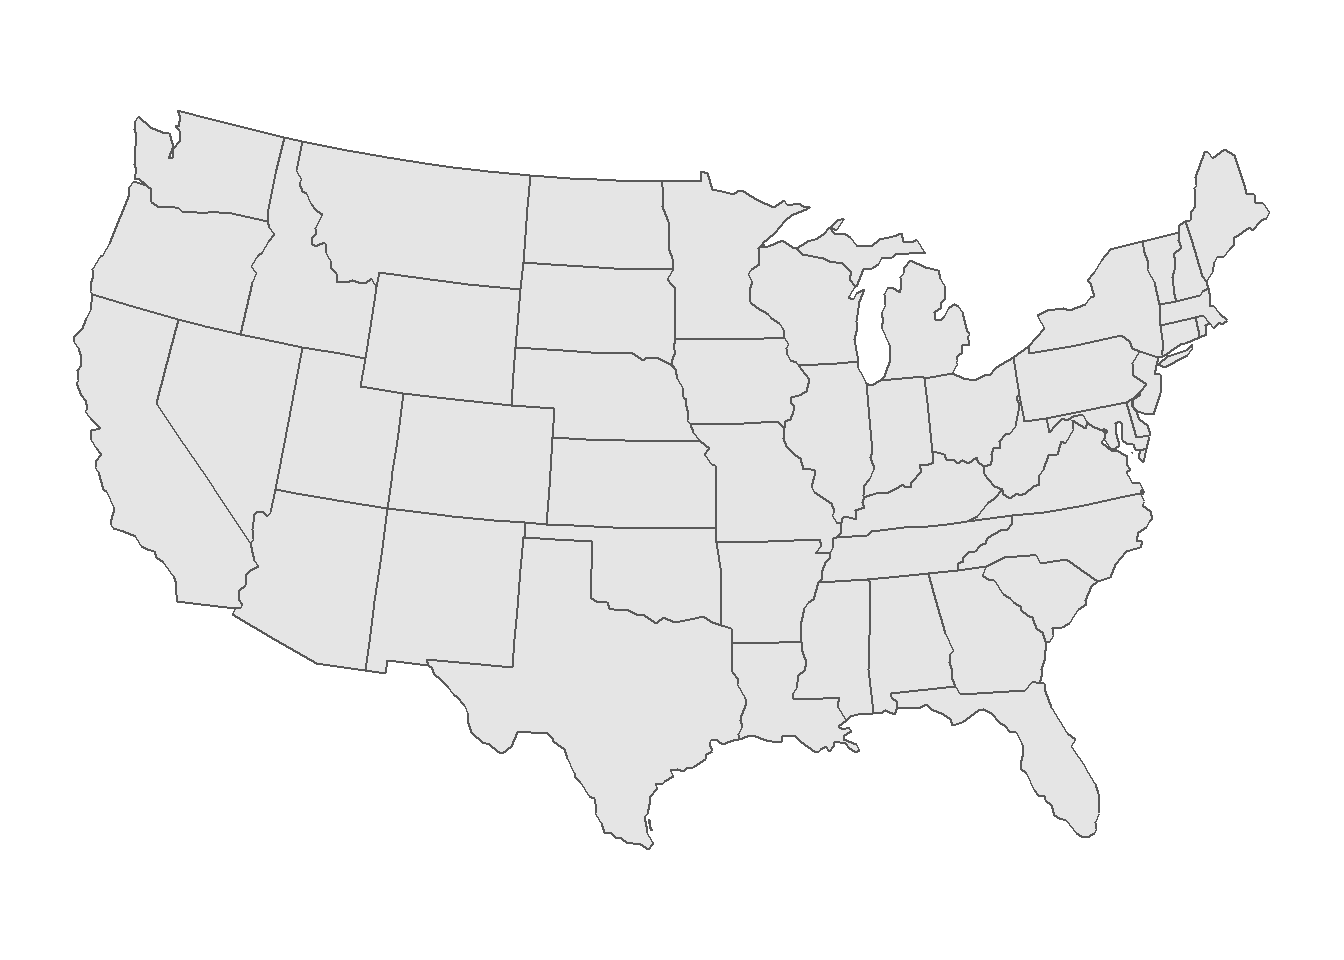
Benchmarking the drawing time of each map will reveal the savings accrued from this one function.
library(microbenchmark)

p1 <- ggplot(states_map) + geom_sf()
p2 <- ggplot(states_map_simp) + geom_sf()

microbenchmark(
  detailed_map   = print(p1),
  simplified_map = print(p2)
)
## Unit: milliseconds
## expr min lq mean median uq max neval
## detailed_map 2633 2714 2803 2755 2854 3503 100
## simplified_map 775 787 837 798 833 1379 100And there it is: the simplified map prints 3 times faster than the detailed map.